آموزش انیمیت اینفوگرافیک ها با After Effects
Udemy - Animate Infographics with After Effects

آموزش انیمیت اینفوگرافیک ها با After Effects
آموزش انیمیت اینفوگرافیک ها با After Effects : در این دوره از هنرمند Marek Mularczyk ، خواهید آموخت که چگونه اطلاعات را به صورت گرافیکی و متحرک به شکلی جذاب و تعاملی ارائه دهید. با بهرهگیری از نرمافزار قدرتمند Adobe After Effects، قادر خواهید بود انواع مختلفی از نمودارها، نمودارهای میلهای و اینفوگرافیکهای پویا را طراحی و اجرا کنید.
همچنین، با یادگیری مفهوم عبارات (Expressions)، میتوانید انیمیشنهای خود را پیچیدهتر کرده و تعاملات کاربرپسندتری ایجاد نمایید. در طول این دوره، بر روی یک پروژه عملی کار خواهید کرد. اگر به دنبال ارتقای مهارتهای خود در زمینه طراحی گرافیک انیمیت شده و ایجاد اینفوگرافیکهای حرفهای هستید، این دوره بهترین گزینه برای شماست.این دوره آموزشی توسط تیم ســافــت ســاز برای شما عزیزان تهیه شده است.
عناوین آموزش انیمیت اینفوگرافیک ها با After Effects :
- ایجاد نمودارها و نمودارهای میلهای متحرک
- طراحی اینفوگرافیکهای پویا و جذاب
- افزایش تعامل مخاطب با محتوا
- یادگیری مفهوم عبارات (Expressions) و کاربرد آن در انیمیشنسازی
عنوان دوره : Udemy – Animate Infographics with After Effects
سطح : متوسط
زمان کل دوره : 0.45 ساعت
تعداد فایل ها : 11
سال آموزش : 2024
فایل تمرینی : دارد
مربی دوره : Marek Mularczyk
نرم افزار : After Effects
زیرنویس انگلیسی : ندارد
Udemy – Animate Infographics with After Effects
In this course, you are going to learn how to create animated and interactive statistics.
Create animated graphs and graph bars
Create animated infographics
Engage the viewers with the content
Learn how to create expressions
This is the course that is going to teach you how to create animated and interactive projects, like animated credit score mobile app mock-up, and similar.
You should have a working knowledge of Adobe After Effects before embarking on this course.
Let’s embark on a journey of creating sophisticated, animated infographics and statistics using Adobe After Effects.
In this course, you are going to use animation techniques, shape creation techniques, and more importantly expressions to create animated infographics and animated statistics. Expressions are little bits of code that you add for it to do something for you, more details in the lessons.
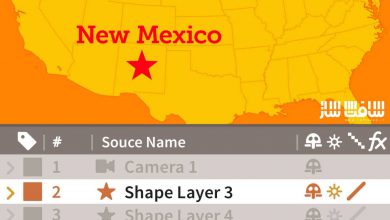
In this class, we are going to work on a project, where we are going to create animated statistics using different animation techniques (as an example here, you are going to create an animated project animating statistics for plant and meat-based foods and their amounts of antioxidants).
You are going to create a project to work with it.
Create your own project and follow along. You can also create a project using your own content and I encourage you to share it with other students here so that everyone can learn from each other, share your ideas and challenges you may encounter.
حجم کل : 0.4 گیگابایت

برای دسترسی به کل محتویات سایت عضو ویژه سایت شوید
برای نمایش این مطلب و دسترسی به هزاران مطالب آموزشی نسبت به تهیه اکانت ویژه از لینک زیر اقدام کنید .
دریافت اشتراک ویژه
مزیت های عضویت ویژه :
- دسترسی به همه مطالب سافت ساز
- آپدیت روزانه مطالب سایت از بهترین سایت های سی جی
- ورود نامحدود کاربران از هر دیوایسی
- دسترسی به آموزش نصب کامل پلاگین ها و نرم افزار ها
اگر در تهیه اشتراک ویژه مشکل دارید میتونید از این لینک راهنمایی تهیه اشتراک ویژه رو مطالعه کنید . لینک راهنما
For International user, You can also stay connected with online support. email : info@softsaaz.ir telegram : @SoftSaaz
امتیاز دهی به این مطلب :
امتیاز سافت ساز
لطفا به این مطلب امتیاز بدید 🦋


